
Learn to read the market
Short lessons on price action, indicators, options and risk. Start with the basics and work your way down.
Guides
Videos
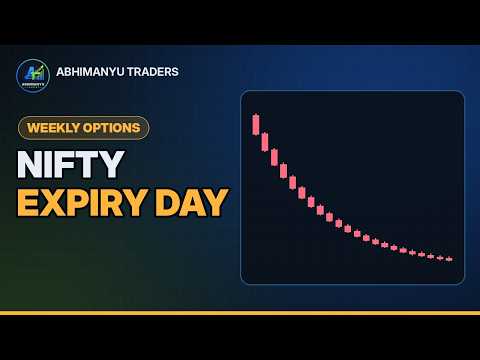 Nifty weekly expiry explained
 How to draw support and resistance
 10 candlestick patterns for beginners
 Position sizing and the 1% rule
Practise on real charts
Free TradingView accountEvery lesson here can be practised on TradingView: draw support and resistance, mark candlestick patterns and replay old price action. The free plan is enough to start.
Open TradingViewAffiliate link: if you later buy a paid plan through it, we may earn a commission at no extra cost to you. We do not give buy or sell recommendations.Quick lessons
BasicsReading a candlestick5 min
Each candle shows four prices for its time period: open, high, low and close. A green (up) candle closed above its open; a red (down) candle closed below it.
The thick body is the distance between open and close. The thin wicks show how far price travelled but could not hold. A long lower wick means sellers pushed price down and buyers bought it back up; a long upper wick means the opposite.
One candle is a clue, not a signal. Read it together with where it formed: a long lower wick at a known support zone means much more than the same candle in the middle of nowhere.
BasicsTrend, higher highs and moving averages6 min
An uptrend is a series of higher highs and higher lows. A downtrend is lower highs and lower lows. Anything else is a range.
Moving averages smooth out noise. The 20 EMA shows the short-term trend, the 50 EMA the medium-term trend and the 200 EMA the long-term one. When price stays above a rising 20 EMA, buyers are in control.
When 20 > 50 > 200 and all three slope up, the trend is clean. When they are tangled together, expect choppy, sideways price and trade smaller or not at all.
BasicsSupport and resistance6 min
Support is a zone where buying has repeatedly stopped a fall. Resistance is a zone where selling has repeatedly stopped a rise. Treat them as zones, not exact lines.
Mark them from swing highs and lows on the daily chart first, then refine on lower timeframes. The more times a zone has been tested, and the more recent the tests, the more traders are watching it.
A resistance that breaks often turns into support on the retest. Many clean trades come from that retest rather than from chasing the first breakout candle.
IntermediateRSI and MACD without the confusion7 min
RSI (14) measures the strength of recent moves on a 0 to 100 scale. Above 70 is called overbought and below 30 oversold, but in a strong trend RSI can stay there for a long time.
A more useful read: in an uptrend, RSI tends to hold above 40 on pullbacks; in a downtrend it tends to fail below 60 on bounces.
MACD is the gap between the 12 and 26 EMAs, with a 9-period signal line. A crossover shows momentum shifting; the histogram shows whether that shift is growing or fading. Use both as confirmation of price structure, never on their own.
IntermediateVolume and VWAP6 min
Volume tells you how much conviction is behind a move. A breakout on volume well above the 20-bar average is more trustworthy than one on thin volume.
VWAP (volume-weighted average price) resets every session and shows the average price paid by everyone today. Institutions often benchmark their buying and selling against it.
Intraday, price holding above a rising VWAP favours long trades; price holding below a falling VWAP favours shorts. VWAP is mainly an intraday tool.
Open interest and PCR8 min
Open interest (OI) is the number of option contracts still open at a strike. Large call OI at a strike often acts as resistance because call writers defend it; large put OI often acts as support.
Put-Call Ratio (PCR) is total put OI divided by total call OI. Roughly 0.9 to 1.3 is normal. Very high PCR shows heavy put writing (bullish positioning but can be stretched); very low PCR shows heavy call writing.
Watch how OI changes, not just its size: rising OI with rising price usually means long buildup, while rising OI with falling price usually means short buildup.
Expiry day and theta7 min
Option premium has two parts: intrinsic value and time value. Time value melts away as expiry approaches, and fastest on the last day. This decay is called theta.
On expiry day, out-of-the-money options can lose most of their value in hours, while at-the-money premiums swing sharply with every move. Gamma is highest here, so positions change value very fast.
Nifty expires every Tuesday and Sensex every Thursday; the last one of the month is the monthly expiry. Check the Expiry Tape for holiday shifts before you plan an expiry-day trade.
RiskPosition sizing and the 1% rule6 min
Decide how much of your capital you are willing to lose on one trade before you pick the quantity. Many traders use 1% or less.
Quantity = (capital × risk %) ÷ (entry price − stop-loss price). Example: with ₹2,00,000 capital and 1% risk, you can lose ₹2,000. If your stop is ₹10 away, trade 200 shares, not more.
An ATR-based stop (for example 1.5 × ATR) keeps the stop outside normal noise. If the correct stop makes the position too small to be worth it, skip the trade.
More lessons are on the way, from chart patterns to how institutions read the option chain. Have a topic you want covered? Tell me.